Navigating Essential Indicators and Timeframes for Day Trading | Beginner-friendly
For a beginner, the stock market can be a pool of possibilities, and knowing which direction to swim in can be confusing and overwhelming at the same time. There are substantial factors a newbie should consider before diving deep into the pool, for instance, trading style, risk tolerance, and the most crucial factor, timeframe.
Analyzing the price movements over time and making trading decisions based on the same can be a tedious task. To overcome this hitch we will understand how to choose the right time frame that complements your trading style and help achieve your overall financial goals.

Understanding Timeframes: Unveiling different timeframes
Trading time frames refer to the duration in which a trader analyzes price movements of scrips on the chart; these timeframes are divided into different intervals like minutes, hours, days, weeks, or months.
Each time frame indicates the Script’s price activity during that period, insights into market patterns, volatility, and prospective trading opportunities.
Let’s get more insights on different timeframes…
- 15 Minutes (Shorter timeframe)
A short time frame carries noise that blurs the underlying market trend, nevertheless, it gives a more profound view of every bump and every fluctuation in the price. This timeframe is ideal for experienced traders with high-risk tolerance and the ability to make split-second decisions under market pressure.
| Pros | Cons |
| Offers quick trading opportunities. | Needs constant monitoring as the price movement frequency is high. |
| Less risk exposure due to shorter holding periods and small stop-loss prices is negligible. | Shorter intervals make the market more receptive to noise and false signals. |
- 30 Minutes (Medium timeframe)
For traders who can’t handle high volatility and dislike being glued to their screen displays, this timeframe strikes the right balance between speed and analysis.
| Pros | Cons |
| Balance speed and stability, providing a midpoint between 15-minute and 1-day charts. | Traders must react quickly to changing market conditions. |
| Allows for greater analysis and confirmation than shorter intervals. | It requires regular monitoring and active management. |
- 1 Day (Longer timeframe)
In this timeframe, the noise is reduced to the minimum and therefore gives a more filtered view to the traders. This is best for beginners, as traders can make better judgments of market patterns and there is no rush to making trading decisions.
| Pros | Cons |
| Requires less frequent monitoring and modifications than shorter intervals. | Trades can take days or even weeks to complete, so patience is required. |
| Intraday market noise and volatility have less impact. | Stop-loss thresholds are usually wider due to lengthier holding periods. |

Choosing the right time frame: Three Key Factors
- Personality: If a trader is comfortable with quick decision-making and a fast-paced environment, then a shorter time frame will be a better fit; otherwise, hold on to a longer time frame for a more methodological approach.
- Trading style: Active traders may prefer shorter time frames, whilst swing traders may choose longer ones.
- Trading Objectives: Choosing a shorter timeframe will mean indulging in short-term profits; on the other hand, a longer timeframe will encourage wealth.
Beyond Timeframes: Exploring Indicators for Day Trading
To complement the power of technical analysis and the use of different indicators, there are two crucial elements to look over: price action and volume.
Price action refers to the study of price movements, which involves analyzing candlestick patterns, support, and resistance levels, and the overall trend. Volume refers to the number of shares or contracts traded in a security over a given time period. High trading volume may imply strong buying or selling pressure.
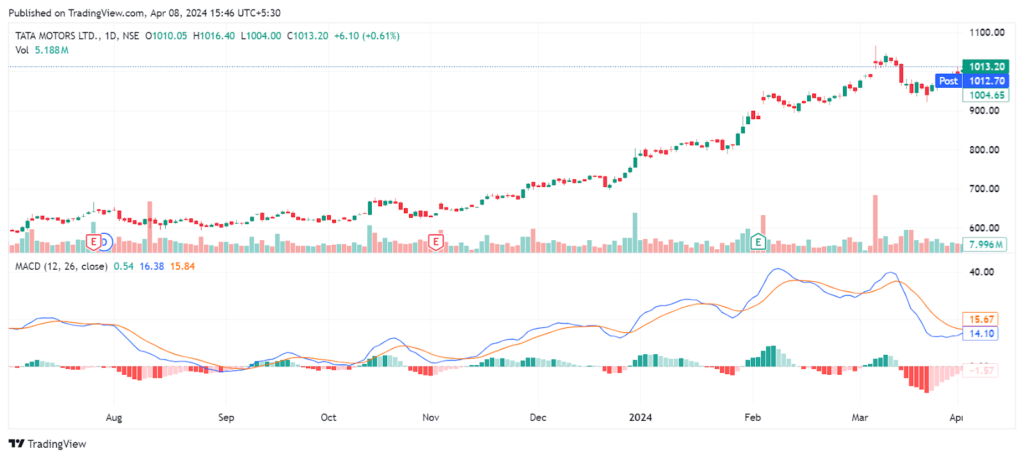
- Moving Average Convergence Divergence (MACD)
MACD is a momentum indicator that helps in the identification of trends. It is made up of two moving averages and a MACD line that determines the difference between them. When the MACD line crosses over its signal line, it can indicate a potential buying opportunity, especially when prices rise and trading volume increases. In contrast, a crossover below the signal line may indicate a selling opportunity, especially if it is accompanied by falling prices and volume.
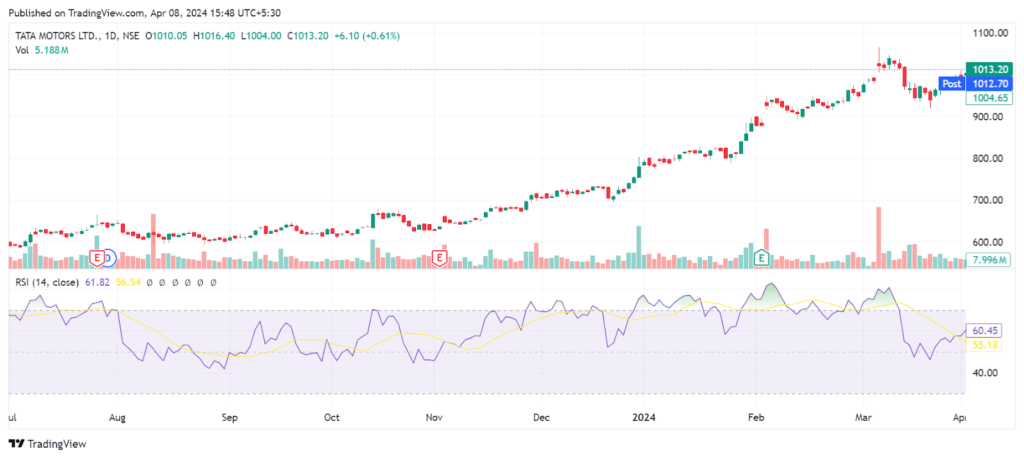
- Relative Strength Index (RSI)
It examines the momentum of price movements and can be used to identify overbought or oversold positions. The RSI scales from 0 to 100, indicating positive and negative divergence. Readings above 70 indicate an overbought market, implying a possible price drop. Readings below 30 indicate an oversold market, pointing to a potential price increase giving a buy signal.
Remember: Technical indicators like MACD and RSI add another layer of analysis, but they should always be used in conjunction with price action and volume to get a better understanding of the market.
Final Word
In the world of trading, it is crucial for traders to have the right tools and knowledge. This guide has provided a foundation for beginners in technical analysis, learning concepts like best indicators and time frame selection. By prioritizing continuous learning, discipline, and commitment to growth, the aspiring day trader will prosper and achieve success. Success takes time and effort; the stock market requires patience and rational decision-making skills. So, experiment with different strategies and pave your way to success.

