ये दिवाली चांदी वाली

Silver Price continued to rise to its highest level
#Silver Dec Future CMP 45400 TGT 58,000
Silver price continued to rise to its highest level breaching the resistance level of INR 45,000 on MCX and made a high of INR 50,675 first time in the last six years. As uncertainty continues to hover in global markets and also concerns of slowing global growth.
After GOLD, it’s time for Silver to outperform the market:-
Gold and silver prices continue to push higher. They’re starting to get some attention from the mainstream, too. A new uptrend in gold is clearly underway, but silver’s performance has so far trailed gold’s. on the eve of Samvat 2076 Silver is our trading bet due to the following reasons:
#1: SILVER UNDERPERFORMS YET:
This year Gold outperformed and traded near to its lifetime high but silver has not performed yet and traded within a range. This year gold gave nearly 20% returns while silver has given 17% returns.
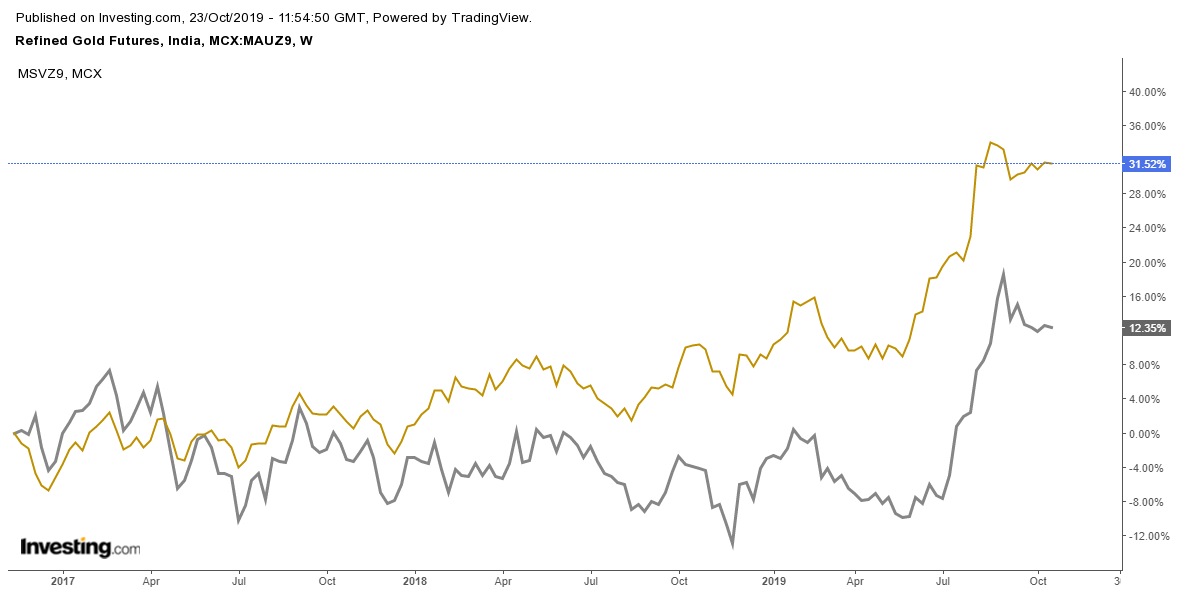
Let’s take a look at the 3 years return chart of Gold and Silver on MCX, as in the chart it can be seen that in the last three years, gold has given a 31.5% return and Silver has given a 12.35% return. So, there is more upside in silver as compared to Gold.
#2: HIGH GOLD-SILVER RATIO:
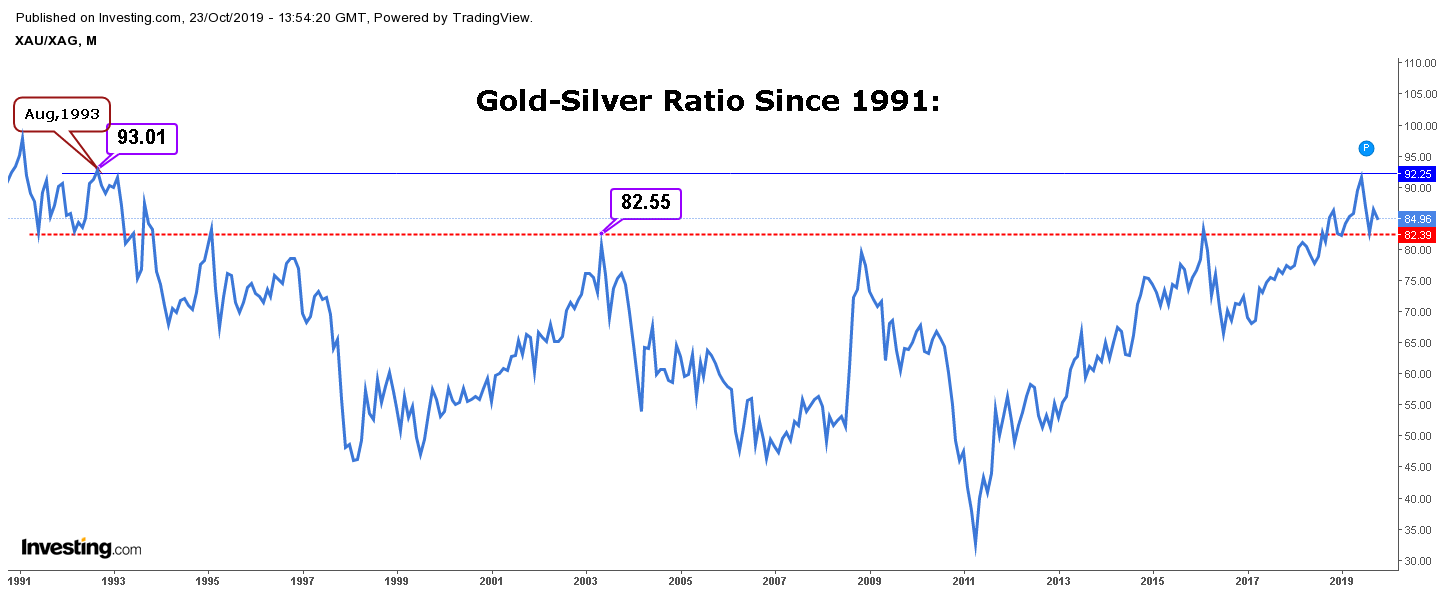
The gold-Silver ratio has crossed its resistance level of 83 after a long time and touched its 27 years high of 93 levels. To Trade according to the Gold-Silver ratio we should first understand what it is:
What is the Gold-Silver Ratio?
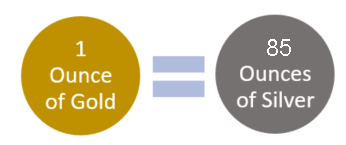
The gold-silver ratio is the number of silver ounces you would need to trade to receive one ounce of gold at current market prices. For example, when gold price is trading at $1500 per ounce and the silver price is trading at $17.64 per ounce the gold-silver ratio will be equivalent to 85.
- The ratio tends to increase during times of economic distress. The cause of this relationship is due to gold generally outperforming silver during recessions, leading to increases in the ratio.
- The ratio peaked at 100 in 1991 when silver prices dropped to extreme lows.
How to Trade the Gold-Silver Ratio:
Trading using Gold-Silver Ratio is quite simple, there may be times when the ratio reaches historic extremes and lows. When it is near these points, a reversal of the ratio is at risk. For example, when the gold-silver ratio reaches historical highs (from 80 to 100) the idea is that the price of gold is expensive relative to the price of silver. When the gold-silver ratio reaches historical lows (from 60 to 40) gold is seen as cheaper relative to silver.
The Gold-Silver ratio chart shows times when the ratio was at all-time highs- red circles and all-time lows-blue circles.

Traders can use the table below as a guide to trade the metals when the gold-silver ratio at risk for a reversal:
| GOLD-SILVER RATIO | GOLD & SILVER TREND | TRADE SIGNAL |
| Historical High | Gold & Silver in Uptrend | Long Silver |
| Historical High | Gold & Silver in Downtrend | Short Gold |
| Historical Low | Gold & Silver in Downtrend | Short Silver |
| Historical Low | Gold & Silver in Uptrend | Long Gold |
It is very seldom that the gold-silver ratio reaches these historic highs and lows, but when it does, it could offer good opportunities. Still, it is important to manage your risk because the ratio may sometimes breach these historical high/low levels.
#3: SILVER READY FOR RANGE BREAKOUT:
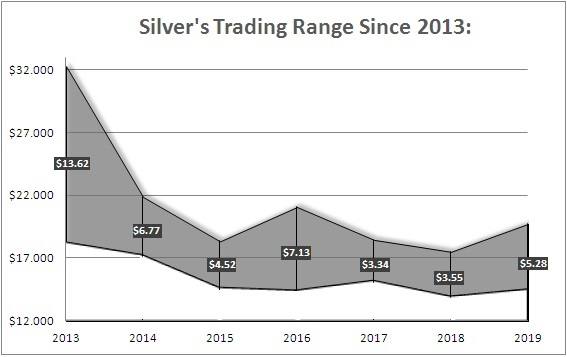
When we plotted the annual trading range of the gold price since 2013 when most traders indicated the bear market in precious metals began. We also indexed the dollar amount of change between the high and low each year.
Notice: in the chart how the Gold price range has shifted higher this year.
Gold’s trading range has shifted remarkably higher in 2019. Not only has the price broken above the flat range of the prior three years but also the series of higher lows, a very bullish indicator.
This insight is perhaps more valuable than a simple line on a chart because it shows that gold’s full price range – both the highs and lows – is trading higher.
The current surge will undoubtedly take a breather at some point, but this big-picture view clearly shows a decisive shift in momentum, one that portends higher and higher prices.

This shift, however, has not taken place in silver. While silver is up roughly 12% in these three years, still it has not given a breakout. In fact, silver is still below 2016’s high of $21.
The lack of a breakout is further confirmed by silver’s tight trading range so far this year which is expected to be broken and a new high can be seen in the next few months.
#4: HISTORY REPEATS ITSELF:
As we saw in past bull markets, Silver usually trails Gold in the beginning stage but outperforms later.
In the below figure, we can see the outperformance of Silver in the last five biggest bull markets since the 1970s, along with Gold’s performance. You can see that Silver usually starts slower than Gold. In three of the five biggest bull markets, silver trailed the gold price in the beginning stages. The lag of silver lasted from several months to as much as several years as compared to the hold. However, at the climax of Bull Run, the shine of Silver adores the investors. Thus, Silver’s behaviour at this point is unusual.
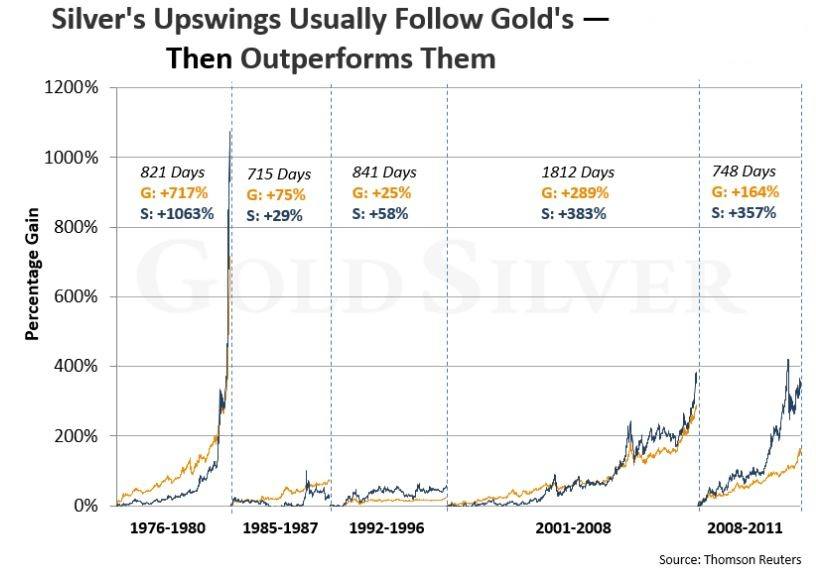
However, despite the slow start, you can see that in every case silver caught up and eventually passed gold’s total return.
In the 1992-1996 and 2008-2011 markets, silver started outperforming gold in the early days of the Bull Run, but in the other three bull markets, it lagged till half of the rally. So we have historical precedents for silver’s current lag.
History says silver’s lag is only temporary. Gold’s breakout officially indicates that Silver is on the launch pad.
Silver has outperformed gold in every major modern-day precious metals bull market (though it did fall below gold before the mid-1980s uptrend ended).
With a breakout in gold, silver is likely next. Even if it’s not quite ready, as per our view the coming explosion in silver is inevitable.
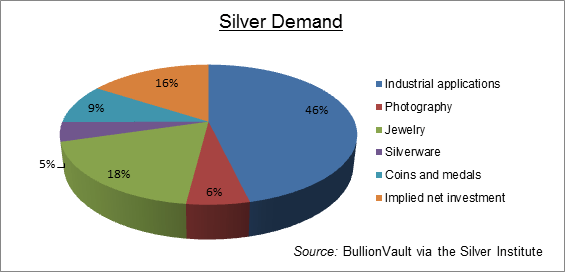
#5: DEMAND & SUPPLY OUTLOOK:
Silver is precious as well as Industrial metal. Silver has applications in industrial fabrication, photography, fashion, electrical, and electronics industries. Hence, there is always a demand for silver. The Silver Institute predicts that in 2019, industrial demand for silver, which is responsible for 60% of the total demand for the metal, will “rise modestly” across industrial operations.
The silver market looks “promising” in 2019 as the supply and demand picture is expected to remain relatively stable compared to 2018, according to the latest research from the Silver Institute.
The institute’s annual World Silver Survey, published Thursday, said that global silver demand hit a three-year high in 2018, surpassing more than one billion ounces, an increase of 4% from 2017.
At the same time, global silver mine production fell for the third straight year, dropping 2% in 2018 to 855.7 million ounces. However, despite strong demand and falling mine supply, silver prices struggled.
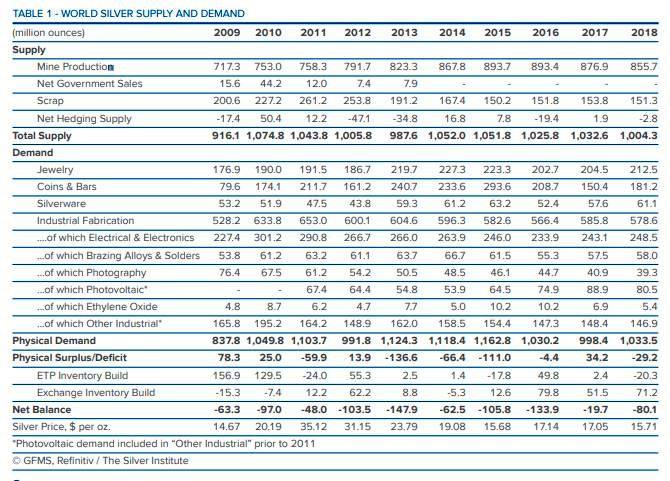
The report noted that in 2018 above ground silver supply totaled more than 2.5 billion ounces, which was a 3% decline from the previous year. However, this was the first decline in above-ground stocks after nine years of consecutive growth. At the current pace of demand, silver inventory represents a two-and-a-half year supply, Wiebe said.
Although Wiebe is positive on silver prices through 2019, he added that it will be difficult for prices to push above $20 an ounce this year because of the overhanging stockpiles.
Even in a struggling price environment, the survey noted that silver remains an attractive alternative safe-haven asset as investors shy away from other expensive assets like gold.
“People are turning to silver because of its huge price divergent with gold,” Wiebe said. “The gold-silver ratio is ridiculously high and is not sustainable, it’s just a question of when the ratio comes down.” (Source: www.kitco.com)
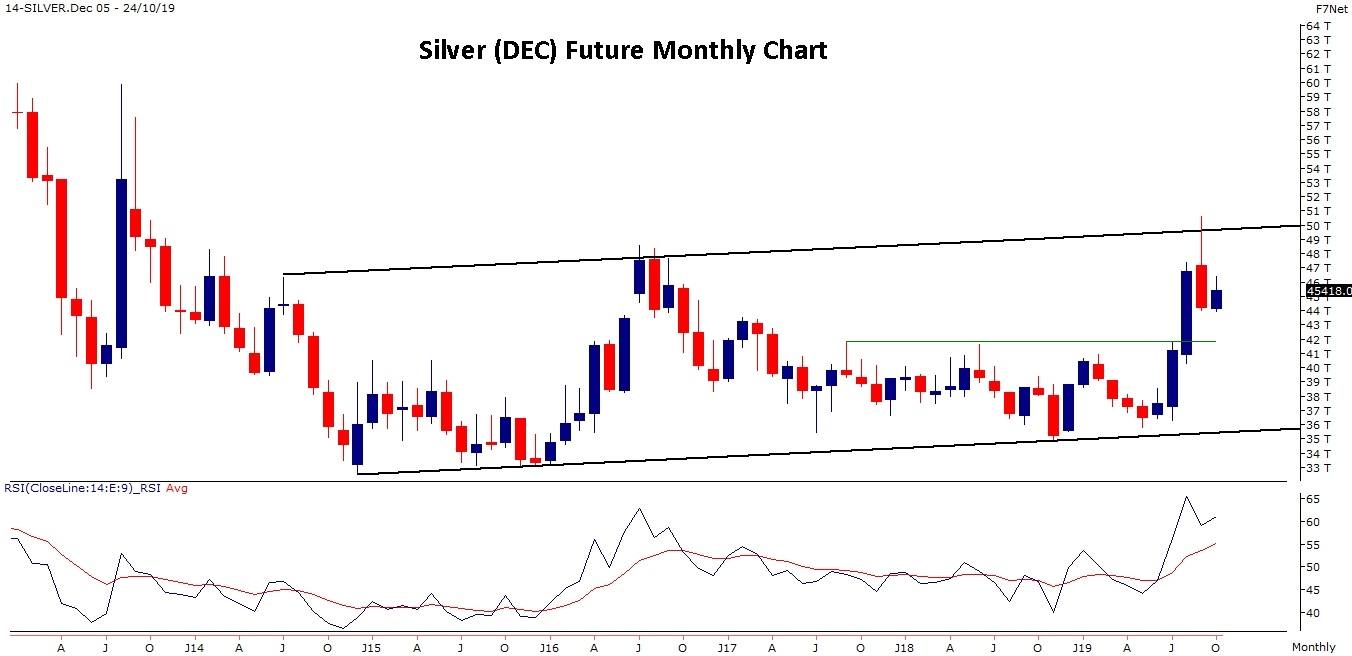
Technical outlook: MCX Silver Dec futures technical chart has formed “Rising Channel” pattern on a monthly time frame. The major trend and the key fundamentals are on the buy-side every dip towards the support level is a good buying opportunity. The upside rally could test up to 51,000-58,000 levels on upcoming months. Key Support levels 43,000-41,800.
Monthly Pivot Table:
| Gold Dec Future | Classic | Woodie’s | Camarilla | DeMark’s |
| Resistance 3 | 56,086.6667 | 47,241.675 | ||
| Resistance 2 | 53,379.3333 | 53,058.75 | 46,627.7833 | |
| Resistance 1 | 49,389.6667 | 48,748.5 | 46,013.8917 | 51,384.5 |
| Pivot Point | 46,682.3333 | 46,361.75 | ||
| Support 1 | 42,692.6667 | 42,051.5 | 44,786.1083 | 44,687.5 |
| Support 2 | 39,985.3333 | 39,664.75 | 44,172.2167 | |
| Support 3 | 35,995.6667 | 43,558.325 |
Start Investing with Arihant Capital: Apply Now

